The Paid Media Metrics Worth Actually Tracking
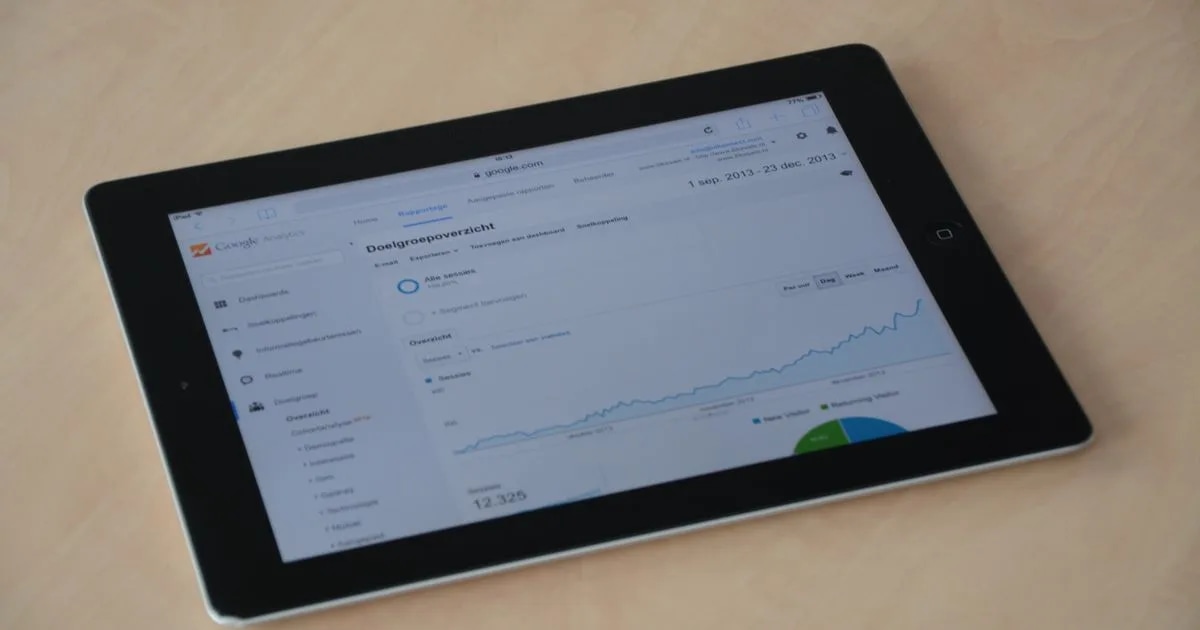
Your ad dashboard has more numbers than your finance spreadsheet. Most of them don't matter as much as you think.
That's not a knock on the platforms. Google, Meta, and every ad tool built on top of them surface a dozen-plus metrics by default. More data feels like more control. But only a handful of those numbers should ever change a budget decision. The rest just describe what happened.
In 2026, that distinction matters more than usual. Average cost per click rose 12.88% across industries. Click-through rate, meanwhile, barely moved at 3.74% (WordStream, 2026). Costs are climbing faster than engagement. This guide sorts the paid media glossary's 38 terms into what should drive a decision, and what's just noise.
TL;DR
- CPC rose 12.88% industry-wide in 2026, while CTR moved just 3.74% (WordStream, 2026)
- ROAS and marketing efficiency ratio (MER) can genuinely disagree with each other, and both can be right at once
- A 3+ second video view drives a 47% ad recall lift (Nielsen, via MarTech, 2026)
- Most dashboard metrics are directional, not decision-grade
| Data Point | Source | Year |
|---|---|---|
| Average CPC change, year over year | +12.88% | WordStream |
| Average CTR change, year over year | +3.74% | WordStream |
| Google Ads average CPC | $5.42 | WordStream |
| Ad recall lift for 3+ second video views | 47% | Nielsen |
| Legal services ROAS (highest-performing vertical) | ~8:1 | Industry benchmark aggregate |
| Healthcare ROAS (lower-performing vertical) | ~2.3:1 | Industry benchmark aggregate |
What Are Paid Media Metrics, and Which Ones Actually Matter?
Paid media metrics are the numbers your ad platforms report on spend, engagement, and results. Not all of them deserve equal weight, though. Some should change a budget decision. Others just describe what already happened.
Call the first group decision-grade: ROAS, break-even ROAS, MER, and cost per acquisition. Call the second group directional: CTR, impressions, frequency, and reach. Directional metrics still matter, but they shouldn't move a budget on their own.
Why split them at all? Because cost and engagement aren't moving together anymore. Specifically, average CPC rose 12.88% industry-wide in 2026. CTR, in the same period, ticked up only 3.74% (WordStream, 2026). As a result, watching engagement alone will hide that spend is quietly getting less efficient.
This split isn't unique to paid media. A similar decision-grade-versus-directional divide shows up in AI tooling too, where a confidence score matters more than raw output speed. For a deeper look at that pattern, see our glossary pillar on AI metrics.
For more on why cross-platform ad data goes stale before anyone notices, see our guide on fragmented data.
ROAS and Break-Even ROAS: The Metric Everyone Watches, Half Right
Return on ad spend (ROAS) measures revenue generated per dollar spent on a campaign. It's the most-watched number in paid media, and also the most misread. A 4:1 ROAS sounds healthy. But whether it's actually profitable depends on your margin, not the ratio itself.
That's where break-even ROAS comes in. It's the minimum ROAS at which a campaign stops losing money, once your actual costs are factored in. A product with thin margins might need a 6:1 ROAS just to break even. A high-margin service might turn a profit at 2:1.
Campaign ROI rounds out this group. Specifically, it's ROAS expanded to include all campaign costs, not just ad spend, like creative production or agency fees. In our experience, teams that only track ROAS often miss this. A campaign can look profitable on ad spend alone while still losing money once production costs are added.
Consider a campaign with a clean 5:1 ROAS on paid spend. Say the creative shoot cost $20,000 and only ran for two weeks. Once that cost is spread across the actual revenue window, true campaign ROI can look very different. ROAS alone would never surface that gap.
See how NeuraBoard's Growth Simulator models a channel budget shift against your actual margin, before you commit real spend.
MER vs. ROAS: Why Your Blended View Might Disagree With Your Campaign View
Marketing efficiency ratio (MER) measures total revenue against total marketing spend across every channel at once. Unlike ROAS, it doesn't isolate a single campaign. It answers a different question: is your marketing, as a whole, getting more or less efficient.
Here's the part that surprises most teams. ROAS and MER can genuinely disagree. A campaign can show a strong 5:1 ROAS while your blended MER quietly declines, because that campaign is pulling customers who would have converted anyway through another channel.
Benchmark aggregators put a healthy blended MER somewhere around 3x to 5x, though the right number depends heavily on your gross margin. A 3x MER at 70% margin leaves real room. In contrast, the same 3x at 40% margin might mean you're losing money after fixed costs.
Meanwhile, this is exactly why finance teams increasingly ask for MER alongside ROAS in board reporting. A campaign-level win doesn't always translate into a company-level one, and the two numbers together tell a fuller story than either alone.
Most paid-media guides explain ROAS and MER separately, as if they measure the same thing at different zoom levels. They don't. One measures a channel; the other measures the business. Reading only one is like checking a single gauge on a dashboard full of them.Read our companion glossary pillar on AI metrics if you're evaluating how an AI Assistant surfaces a metric disagreement like this one automatically.
Cost Metrics: CPC, CPM, CPA, and Cost Per Result
Cost metrics tell you what you're paying. They never tell you, by themselves, what you're getting for it. That's why a rising cost per click (CPC) or cost per mille (CPM) should always be read next to a performance number, not in isolation.
In 2026, Google Ads averages $5.42 CPC across industries, ranging from roughly $1.63 in low-competition verticals to nearly $9.87 in legal services (WordStream, 2026). Meta's average CPC and CPM run lower across most benchmark compilations, though figures vary by source and season, so treat any single Meta number as directional rather than exact.
Notably, WordStream's report is one of the few in this space that names its methodology: campaign data pulled from thousands of live Google Ads and Microsoft Ads accounts across 20 industries. That's worth knowing, because much of the paid-media benchmark space is aggregator blogs republishing each other's numbers with little original data behind them.
Cost per acquisition (CPA) and cost per result narrow the focus further. CPA measures cost per conversion specifically. Cost per result is the platform-native version of the same idea, scoped to whatever goal you set for a given campaign, whether that's a lead, a purchase, or a sign-up.
Engagement Metrics: CTR, Frequency, Reach, and Impressions
Click-through rate (CTR), impressions, reach, and frequency describe how an audience is responding to an ad. None of them, on their own, confirm that a click or a view turned into revenue.
That gap showed up clearly in 2026. CTR moved just 3.74% year-over-year industry-wide, even as CPC rose nearly 13% in the same window (WordStream, 2026). Engagement and cost efficiency are moving on separate tracks right now.
Frequency and frequency cap matter for a different reason: fatigue. Show the same ad too many times to the same person, and engagement drops even if reach stays flat. Video view rate works similarly for video specifically, measuring how many viewers watch past a meaningful threshold rather than scrolling past.

Quality Signals: Quality Score and Ad Relevance Score
Quality Score is Google's own verdict on how relevant your ad, keyword, and landing page are to each other. A low score quietly inflates every cost metric sitting above it in your dashboard, since platforms charge more to show lower-relevance ads.
Ad Relevance Score is Meta's rough equivalent, though it's folded into a broader relevance diagnostics ranking rather than shown as a single number. Either way, the lesson is the same: a rising CPC isn't always a market problem. Sometimes it's a relevance problem you can actually fix.

See how NeuraBoard's AI Assistant surfaces why a cost metric moved, instead of leaving you to guess between a market shift and a relevance drop.
Brand and Retargeting Metrics: What Last-Click Attribution Misses
Brand lift, retargeting rate, and lookalike audience performance measure impact that a last-click conversion metric never sees, especially for upper-funnel spend that influences a purchase without directly closing it.
Nielsen found a 47% ad recall lift among viewers exposed to at least three seconds of a video ad, based on its analysis of Facebook video campaigns (Nielsen, via MarTech, 2026). That's recall, not a click. It still shapes whether someone recognizes your brand later, at the exact moment a last-click report would give the credit to a different, cheaper channel entirely.
Retargeting rate and lookalike audience targeting both lean on this same idea. In fact, retargeting ads generally outperform cold-audience display on both CTR and conversion rate, often substantially, though the exact multiple varies widely across benchmark sources. Lookalike audiences, meanwhile, extend that logic outward, targeting new users who statistically resemble your best existing customers.
Importantly, neither metric shows up cleanly in a standard conversion report. A retargeting campaign's real value often gets attributed to whichever channel happens to close the sale last, even when the retargeting exposure is what kept the brand top of mind. That's a familiar blind spot for any team relying on single-touch attribution.
Reading a Dashboard Like an Operator, Not an Analyst
If you already know what each metric means, here's how to triage a dashboard in under two minutes: check blended MER first, then break-even ROAS, then everything else.
In our experience, teams that watch campaign-level ROAS but never check blended MER often keep scaling a channel that looks great in isolation. It's quietly cannibalizing conversions another channel would have earned anyway. Only the blended view catches that pattern.Compare that against your break-even number next, not a generic industry benchmark. A 4:1 ROAS that beats your break-even by a wide margin deserves more budget. A 4:1 ROAS that barely clears break-even doesn't, no matter how impressive the ratio looks on a slide.
Compare plans on NeuraBoard's pricing page once you know what to check for.
Tools and Resources for Evaluating Paid Media Metrics
Start free: WordStream's annual Google Ads benchmark report is genuinely useful, since it names its methodology and updates yearly with real campaign data. Meta's own Ads Manager also surfaces relevance diagnostics directly, no third-party tool required.
When we review a client's paid media setup, blended MER is the first number we ask for, before any single campaign's ROAS. It tells us in seconds whether the account, as a whole, is trending toward efficiency or away from it.For deeper category-specific benchmarks, most agencies compile figures from several sources rather than trusting one. That instinct is correct. Treat any single-source paid-media benchmark, including the ones in this guide, as directional until you can check it against your own account history.
Similarly, a quality-score diagnostic inside your own ad platform will always beat a third-party benchmark for deciding what to fix first. Benchmarks tell you what's typical elsewhere; your own dashboard tells you what's actually happening in your account.
Getting Started
Pull your blended MER for the last 30 days before you look at any single campaign's ROAS. That one number tells you more about overall marketing health than a dozen campaign-level metrics combined.
Next, check your break-even ROAS for your actual margin structure, not a generic "4:1 is good" rule of thumb. Your number might be higher or lower, and that's fine. It just needs to be yours.
Finally, bookmark this glossary. The next platform acronym that shows up in a pitch deck or a new dashboard tab will be easier to place once you know which tier it belongs to.
Frequently Asked Questions
What's a good ROAS?
It depends heavily on industry and margin. Benchmark aggregators put legal services around 8:1 and healthcare closer to 2.3:1, with most other verticals in between. Your own break-even ROAS matters more than any industry average.
What's the difference between ROAS and MER?
ROAS measures a single campaign's return. MER measures your total revenue against total marketing spend across every channel. The two can disagree, and both can be correct at the same time.
Why did my CPC go up?
Industry-wide CPC rose 12.88% in 2026 even as CTR barely moved, a broad auction-cost trend rather than necessarily a problem with your specific campaign (WordStream, 2026).
Is a high CTR always good?
No. CTR measures attention, not revenue. A high CTR with a low conversion rate usually means the ad promises something the landing page doesn't deliver.
What is break-even ROAS?
It's the minimum ROAS at which a campaign stops losing money once your actual costs are factored in. It varies by product margin, not by platform or industry averages.
Do brand and retargeting metrics matter if I already track ROAS?
Yes. Nielsen found a 47% ad recall lift for viewers exposed to 3+ seconds of video (Nielsen, via MarTech, 2026), an impact that a last-click ROAS report never captures.
The Bottom Line
Most paid media dashboards mix decision-grade metrics with directional ones and never label which is which. That's the actual problem, more than any single number being wrong.
ROAS and break-even ROAS tell you whether a campaign is profitable. MER tells you whether your marketing, as a whole, is getting more efficient. Everything else, CTR, impressions, frequency, quality scores, adds context, but shouldn't move a budget on its own.
Curious what it looks like when an AI Assistant flags a metric disagreement like ROAS versus MER automatically? See how NeuraBoard's Growth Simulator models a budget shift before you commit real spend.
This article was written and reviewed by the NeuraBoard editorial team. Statistics were sourced from named, publicly available industry and research reports and cited inline. Where benchmark figures vary significantly by source, we've noted that explicitly rather than presenting a single number as settled fact. Have questions or a correction? Contact us.

Editorial Team
The Neura Review is written by NeuraBoard's editorial team, covering the metrics, systems, and insights behind data, AI, and growth. NeuraBoard itself is the intelligence layer that unifies revenue, ad spend, and marketing data, answering business questions directly instead of leaving teams to build reports by hand.