Why Fragmented Data Is Killing Your Growth
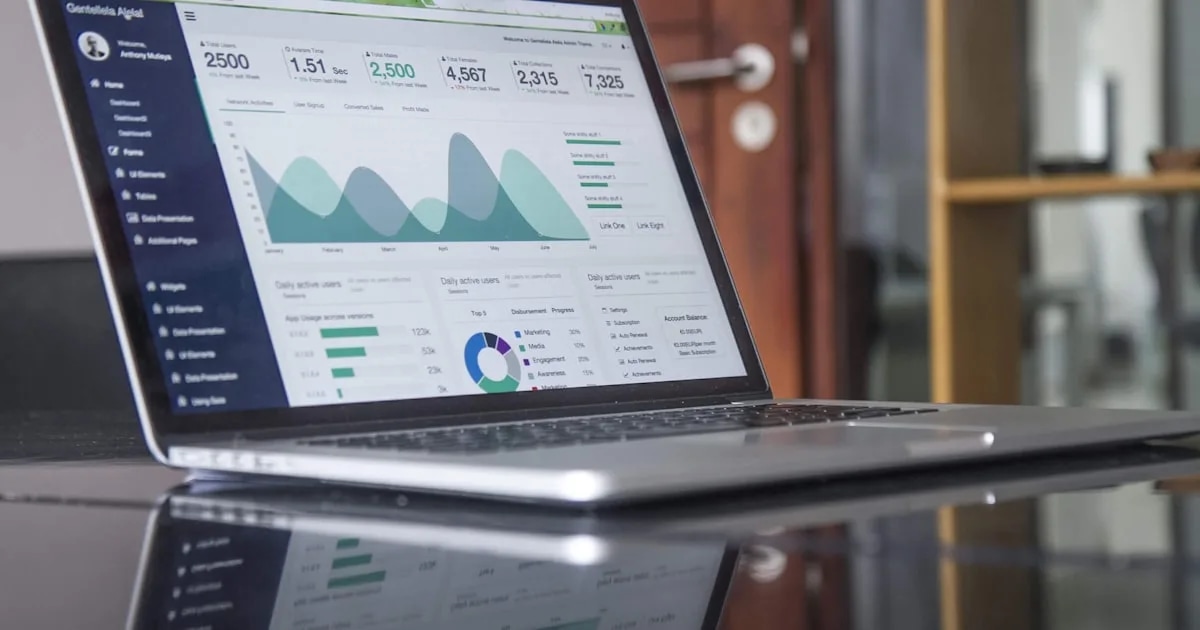
Most growing businesses aren't short on data. Ad performance lives across Google, Meta, TikTok, LinkedIn, and Snapchat. Revenue lives in Shopify and Stripe. Email metrics live in Klaviyo. CRM data lives in HubSpot. In other words, they're short on a single place to see it all together.
That gap is fragmented data, and it's one of the most damaging, least talked about growth problems a small or mid-sized business can have.
TL;DR
- Growth-stage companies with 1-500 employees run an average of 152 separate SaaS apps (Zylo, 2025)
- 65% of B2B marketers spend 5+ hours a week on manual data work, and 38% spend more than 10 (Pipeline360, 2024)
- 68% of organizations now name data silos their top data-management concern (DATAVERSITY, 2024)
- 88% of organizations now use AI regularly in at least one business function (McKinsey, 2025), but most tools still only visualize data instead of interpreting it
- Centralizing data, then adding an AI layer on top, turns scattered dashboards into a system that tells you what to do next
| Data Point | Source | Year |
|---|---|---|
| 152 avg SaaS apps at companies with 1-500 employees | Zylo | 2025 |
| 106 avg SaaS apps across all company sizes | BetterCloud | 2024-2025 |
| 65% of B2B marketers spend 5+ hrs/week on manual data work | Pipeline360 | 2024 |
| 68% cite data silos as top data-management concern | DATAVERSITY | 2024 |
| 88% of orgs use AI regularly in some function | McKinsey | 2025 |
| 91% of AI-adopting SMBs report a revenue boost | Salesforce | 2024 |
What Does Fragmented Data Actually Mean?
Fragmented data is business information spread across disconnected platforms, with no central place to view or compare it. In fact, growth-stage companies with 1-500 employees average 152 separate SaaS applications, more per employee than most large enterprises run (Zylo 2025 SaaS Management Index). Meanwhile, the average company across all sizes runs 106 apps, down from a 2022 peak of 130 but still well over 100 (BetterCloud, 2024-2025). Notably, the sprawl happens gradually. One team adopts a tool, then another team adopts a different one, and within a year nobody has the full map.
So what does that sprawl actually look like day to day? When your ad spend lives in one tool and your revenue lives in another, you can't easily tell if a campaign is actually working. Similarly, when email performance is disconnected from sales data, you can't measure marketing's real impact. Sound familiar?
What Does Fragmented Data Actually Cost You?
The cost rarely shows up as a single line item. Instead, it shows up as friction: slower decisions, missed opportunities, wasted spend. Here's where it hides.
Hours Lost to Manual Reporting
Someone on the team spends time every week pulling data from multiple platforms and assembling it into a spreadsheet, and that time adds up fast. Specifically, Pipeline360's 2024 survey found 65% of B2B marketers spend five or more hours a week manually ensuring lead and data quality. Notably, 38% spend more than 10 hours a week on it (Pipeline360, 2024). In our experience working with growing marketing teams, reporting alone can quietly eat a full day of strategic work every week.
Decisions Made on Incomplete Information
When you can only see part of the picture, you make decisions based on partial information. For instance, you might double down on a channel that looks strong in isolation but is actually cannibalizing another. Alternatively, you might cut spend on a campaign that looks underperforming when it's actually driving downstream conversions you can't see. In other words, fragmented data doesn't just slow decisions, it makes them less accurate.
Slow Reaction to Problems
When data is scattered, problems don't get caught early. A drop in conversion rate, an ad account burning budget, a sudden jump in customer acquisition cost: these should trigger immediate action. However, if you're only reviewing each platform separately and infrequently, you find out about problems after they've already cost you.
Missed Connections Between Channels
Growth rarely happens in a single channel. Rather, it happens in the interaction between them. Consider a customer who sees your TikTok ad, Googles your brand, clicks a search ad, opens a Klaviyo email, and converts on Shopify. If your data is fragmented, you never see that full journey. Consequently, you optimize each channel in isolation and miss the compounding effect of how they work together.
Strategy Built on Gut Feel
When pulling real data is painful, people stop doing it as often. Strategy meetings happen without current numbers, and decisions get made on what feels right rather than what the data shows. Data silos are isolated pockets of information that don't connect to the rest of the business. Accordingly, they're now the top data-management concern for 68% of organizations, up seven points year over year (DATAVERSITY, 2024). Accordingly, once a team stops trusting its own numbers, gut feel becomes the default operating model, and it stays that way until real data gets easier to reach than a guess. That pattern, in our experience, is what actually separates teams that scale smoothly from teams that stall out despite spending just as much.
Why Does This Get Worse as You Grow?
Fragmented data is manageable with one or two channels. In contrast, it becomes a real liability at five or ten. Early on, you might run just Shopify and one ad platform, easy enough to track by hand. But every new channel, team member, and tool adds to the pile. As a result, the time needed to consolidate it manually grows right along with it. So does the chance something slips through the cracks, and the cost when a decision turns out wrong, because the stakes only get higher as the business does.
What Does Fixing It Actually Look Like?
Solving fragmented data doesn't require a data engineering team or an enterprise budget. Instead, it requires one centralized platform that connects your tools and brings data together automatically. Once that's in place, a few things change at once.
- Reporting becomes automatic. Instead of pulling data by hand, the platform assembles it for you, and reports that used to take hours now take seconds.
- Performance becomes visible across channels. You can see how ad spend connects to revenue, not just how each channel looks in isolation.
- Problems surface faster. Anomalies show up the moment they appear, not after a weekly review.
- Strategy gets grounded in reality. Planning happens with current numbers on the table, not last month's screenshot.
The AI Layer That Changes Everything
Centralizing data solves fragmentation. That said, the next step is using AI to interpret it. Even with clean, unified data, someone still has to look at the week's numbers and figure out what changed and why. AI-powered BI means business intelligence software that interprets data instead of just displaying it, and it's gaining ground fastest. In fact, 88% of organizations now report regular AI use in at least one business function, up from 78% a year earlier (McKinsey, "The State of AI in 2025", 2025). In fact, Salesforce's 2024 Small & Medium Business Trends Report surveyed 3,350 SMB leaders and found 91% of AI-adopting SMBs said AI had already boosted their revenue (Salesforce, 2024).
Instead of a dashboard that just shows what happened, an AI layer tells you what it means and what to think about next. In other words, that's the difference between data that sits there and data that drives decisions. Specifically, the same interpretation layer can carry through daily briefings and performance reports, so the analysis isn't a one-off summary but something that shows up everywhere you touch your numbers. That consistency, more than any single report, is what changes how a team actually works day to day.
How Does NeuraBoard Solve Fragmented Data?

NeuraBoard connects to 12 widely used business platforms, including Google Ads, Meta Ads, TikTok Ads, Stripe, QuickBooks, HubSpot, Klaviyo, and Google Analytics. Once connected, data updates automatically every day: no manual exports, no spreadsheet assembly, no toggling between dashboards. On top of that centralized data, NeuraBoard's AI generates performance reports, tracks KPIs against targets, answers questions through a built-in AI Assistant, and helps model growth scenarios before you commit to them. In short, it's the shortest route from a dozen scattered logins to one place where you can see and act on everything. See exactly how it connects to your existing stack on the pricing and integrations pages.
Frequently Asked Questions
What is fragmented data in a business context?
Fragmented data is business information spread across multiple disconnected platforms, like ad accounts, e-commerce, email, and finance tools, with no central place to view or analyze it together. It leaves teams working from partial pictures instead of one complete view.
How much time does fragmented data actually cost a team?
A lot more than most teams estimate. Pipeline360's 2024 survey found 65% of B2B marketers spend 5+ hours a week on manual data work, and 38% spend more than 10, time that could go toward strategy instead of spreadsheet assembly (Pipeline360, 2024).
How many tools does the average business actually have to juggle?
More than most people assume. Growth-stage companies with 1-500 employees average 152 separate SaaS apps, well above the 106-app average across all company sizes (Zylo, 2025).
Do you need a data team to fix fragmented data?
No. Solving fragmentation doesn't require a data engineering team or enterprise budget. Instead, it requires a centralized platform that connects your existing tools and updates automatically.
What does AI add on top of centralized data?
Centralizing data solves fragmentation, but AI adds interpretation. Instead of a dashboard that just shows numbers, an AI layer tells you what changed and why, which in turn closes the gap between having data and acting on it.
The Bottom Line
Fragmented data is a growth tax. It costs time, slows decisions, hides problems, and keeps you from seeing how your business actually works as a whole.
Importantly, the businesses that grow fastest aren't the ones with the most data. Rather, they're the ones who can see and act on it faster than everyone else. Centralizing your data is the first step. Using AI to interpret it is what gives you the edge.
This article was written and reviewed by the NeuraBoard editorial team. Statistics were sourced from named, publicly available industry and research reports and cited inline. Have questions or a correction? Contact us.

Editorial Team
The Neura Review is written by NeuraBoard's editorial team, covering the metrics, systems, and insights behind data, AI, and growth. NeuraBoard itself is the intelligence layer that unifies revenue, ad spend, and marketing data, answering business questions directly instead of leaving teams to build reports by hand.