AI Business Intelligence in 2026
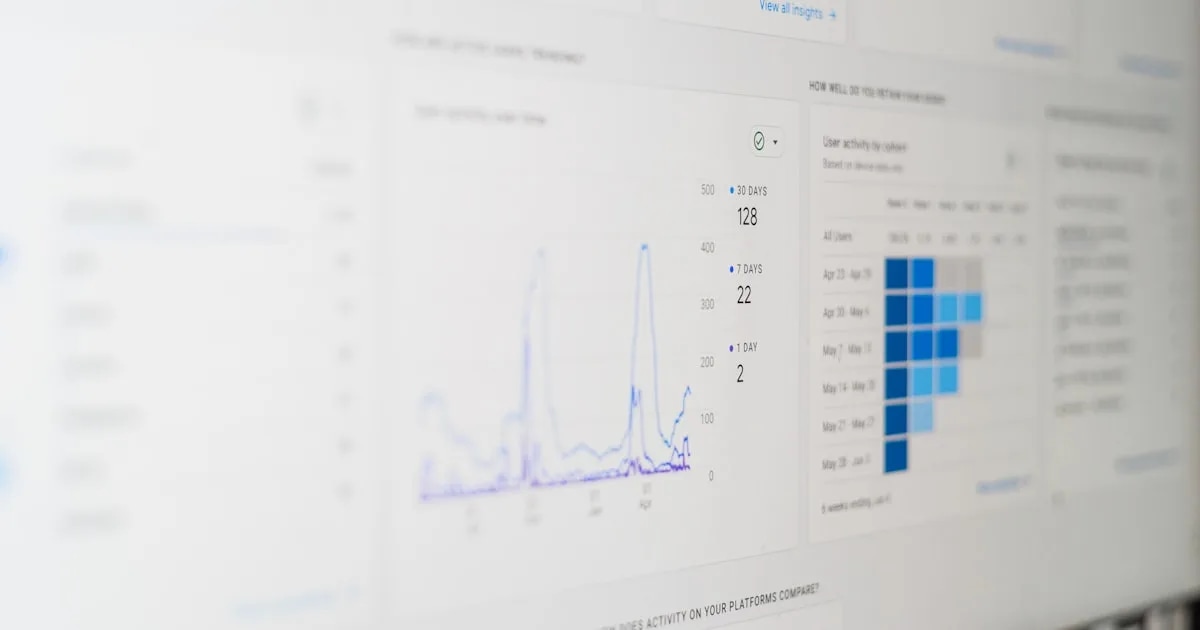
Most business intelligence tools are excellent at one thing: showing you a chart. They're much worse at telling you what that chart means, or what to do about it. That gap, between seeing data and understanding it, is where AI business intelligence actually lives.
The augmented analytics market is on track to grow from $29.81 billion in 2025 to $127.18 billion by 2031, a 27.35% compound annual growth rate (Mordor Intelligence, 2026). But most of that growth still isn't reaching small and mid-sized businesses, the companies that arguably need it most.
This guide breaks down what AI-powered BI actually changes: how it explains why a metric moved, how it models budget scenarios before you commit real money, and why some companies are capturing the upside while others are stuck watching the same static charts they had five years ago.
TL;DR
- The augmented analytics market is set to hit $127.18B by 2031, and SMBs are its fastest-growing segment at a 29.35% CAGR (Mordor Intelligence, 2026)
- Small business AI use jumped from 36% to 89% in three years, but AI use in finance decisions plateaued near 59% (U.S. Chamber of Commerce, 2026; Gartner, 2025)
- Firms with fewer than 20 employees still lag at under 20% adoption, versus 37% at firms with 250+ staff (U.S. Census Bureau, 2026)
- The real differentiator is AI that explains why a metric moved and models what happens next, not another dashboard
| Data Point | Source | Year |
|---|---|---|
| $127.18B projected augmented analytics market size by 2031, up from $29.81B in 2025 | Mordor Intelligence | 2026 |
| 29.35% CAGR for SME-segment adoption vs. 27.35% market-wide | Mordor Intelligence | 2026 |
| 89% of small businesses now use AI in some capacity, up from 36% in 2023 | U.S. Chamber of Commerce | 2026 |
| 59% of finance leaders use AI in the finance function, up from 37% in 2023 | Gartner | 2025 |
| 37% AI adoption at firms with 250+ employees vs. under 20% at firms with <20 employees | U.S. Census Bureau | 2026 |
| 33.5% of daily generative AI users saved 4+ hours in a given week, vs. 20.5% of weekly users | Federal Reserve Bank of St. Louis | 2025 |
What Is AI Business Intelligence?
AI business intelligence, or AI-powered BI, is BI software that interprets data instead of just displaying it. Where a traditional dashboard charts what happened, AI-powered BI explains why it happened and recommends what to do next.
That distinction matters more than it sounds. Gartner predicts that by 2027, 75% of analytics content will be generated using generative AI to add contextual intelligence to raw numbers (Gartner, 2025). The chart itself is becoming a smaller part of the product. The narrative wrapped around it, what changed and why, is becoming the actual value.
A traditional dashboard typically does three things: pulls data from connected sources, visualizes it in charts and tables, and lets you filter or drill down manually. Every step still needs a human to look, interpret, and decide.
AI-powered BI adds a layer on top of all three. It can flag an anomaly before you'd notice it scrolling through a report. It can answer a plain-language question like "why did churn spike last month" instead of making you build a new report to find out. It can model what happens to revenue if you shift ad spend between channels, before you actually shift it.
In practice, that AI layer usually shows up as three connected capabilities:
- Anomaly detection, flagging a metric that moved outside its normal range without you asking it to look
- Plain-language querying, letting you ask a question in normal words instead of building a filtered report
- Scenario modeling, projecting the likely outcome of a decision before you commit budget to it
Most tools today have one of these. Few have all three connected to the same unified data.
None of this replaces the dashboard entirely. You still need the underlying numbers to be accurate and current, and that interpretation layer only works once your data is actually unified in one place, which is why fragmented data quietly taxes growth in the first place. What changes is what happens after the numbers load: instead of a blank chart waiting on a human analyst, there's an AI layer already looking for what matters.
Why Is AI-Powered BI Growing So Fast Right Now?
The augmented analytics market, software that uses AI and machine learning to automate data prep, insight generation, and natural-language querying, is projected to grow from $29.81 billion in 2025 to $127.18 billion by 2031, a 27.35% compound annual growth rate (Mordor Intelligence, 2026). That's roughly 4x growth in six years.
Large enterprises still hold most of that market today, 69.4% of it, largely because they were first to afford dedicated data science teams. But small and mid-sized businesses are now the fastest-growing segment, expanding at a 29.35% CAGR compared to the market's overall 27.35% (Mordor Intelligence, 2026).
Why the shift? Two things happened at once. First, the underlying AI models got good enough to interpret messy, real-world business data without a data scientist tuning them by hand. Second, the tools built on those models got affordable enough for a 30-person company to actually buy, not just a Fortune 500 one.
That second point is the one that matters for most growing businesses. In our experience talking with growth-stage operators, the objection was never "AI-powered BI sounds useless." It was "I assumed that was for companies with a data team, not us." That assumption is increasingly out of date, and it's worth asking who's actually catching up fastest, and who's still stuck watching static charts.
The Adoption Paradox: Why "Using AI" and "Using AI for Decisions" Aren't the Same Thing
Small business AI adoption jumped from 36% in 2023 to 89% in 2026, according to the U.S. Chamber of Commerce's 2026 Small Business Survey (U.S. Chamber of Commerce, 2026). That looks like near-universal adoption. It isn't telling the whole story.
Look at AI use specifically inside financial decision-making, and the picture changes. Gartner's survey of finance leaders found AI use in the finance function grew from 37% in 2023 to 58% in 2024, then barely moved to 59% in 2025 (Gartner, 2025). Adoption stalled right where it started to matter most.
Both lines started at almost the same point in 2023. Three years later, they've split completely. Broad, surface-level AI use, a chatbot here, an auto-generated summary there, kept climbing. Deep AI use, the kind that actually touches budget decisions and revenue forecasts, flattened out.
Why the split? Most "AI-powered" tools bolt a chatbot onto an existing dashboard and call it done. Ask it a real financial question, and it can summarize what's already on screen. It can't reason across your actual connected data or model a scenario you haven't already charted. That's a meaningfully different product than an AI layer built to interpret unified data across platforms.
There's a simple test for telling the two apart. Ask the tool a question that requires connecting two different data sources, like "did the drop in signups correlate with the ad spend cut last week." A chatbot bolted onto a dashboard will either dodge the question or answer only half of it. An AI layer built on unified data will actually cross-reference both and give you a direct answer.
Why Did My Revenue Drop? How an AI Assistant Finds the Answer
A static dashboard shows you that revenue dropped 12% last week. It doesn't tell you why, and finding out usually means pulling reports from three or four different tools and comparing them by hand.
An AI Assistant built into a BI platform closes that gap by design. Ask it directly: "why did revenue drop last week." In seconds, it cross-references your connected ad platforms, CRM, and payment processor. Then it surfaces the actual driver: a paused ad campaign, a spike in refunds, a pricing change, a seasonal dip.

That's the practical difference between a chart and an answer. A chart requires you to already know what question to ask and where to look. A plain-language AI Assistant lets you ask the question you actually have, in the words you'd use with a colleague, and get a specific, sourced answer back.
Revenue rarely drops for one reason alone. It's often a shift in customer acquisition cost or a change in net revenue retention showing up downstream. This matters more than it might seem, because the alternative isn't "no answer," it's a slower, guessed one. Someone on the team eventually pieces it together manually, after the drop has already cost a few more days of misdirected spend.
What Is a Growth Simulator, and How Does Budget Scenario Modeling Work?
A Growth Simulator lets you test a budget decision before you make it, instead of finding out three weeks later whether it worked. Enter a scenario, shifting 20% of ad spend from one channel to another, for instance, and it models the likely effect on revenue, CAC, and margin based on your actual historical performance.

That's a meaningfully different workflow than the usual approach: make the change, wait a month, look at the dashboard, and hope the shift you see is actually caused by the change and not something else entirely.
Budget scenario modeling tools have existed for years in enterprise marketing mix modeling, but they've typically required a data science team to configure and run. A Growth Simulator built into a BI platform does the same underlying job on your actual connected data, without that setup overhead. The practical use case looks like this: before a quarterly budget meeting, run two or three scenarios, like "what if we cut Meta spend 15% and shift it to Google," and walk in with modeled outcomes instead of a guess. It won't replace judgment. It replaces guessing blind.
How Does AI-Native KPI Tracking Differ From a Static Target?
A traditional KPI dashboard shows you a number and a target, and leaves the rest to you: noticing when you're off track, figuring out why, and deciding what to adjust. An AI-native KPI Tracker does the noticing and the "why" automatically, then flags it before the gap widens.
Set a target, say a 25% gross margin, and instead of just plotting the actual number against it monthly, an AI layer tracks the trajectory continuously. It flags when you're on pace to miss it, often weeks before a monthly report would have caught it.
That earlier warning is the entire value. A KPI you only check monthly can drift for weeks before anyone notices. By the time it shows up in a report, the fix usually costs more: more ad spend to recover lost momentum, more time to correct a pricing error, more effort to win back churned accounts.
Combine that trajectory-tracking with the same AI layer that explains revenue changes, and KPI tracking stops being a rearview mirror. It becomes something closer to a windshield: a signal that tells you where you're headed before you get there, not just where you've been.
Why Are Smaller Companies Furthest Behind, and How Do You Close the Gap?
Firms with fewer than 20 employees report under 20% AI adoption, with no significant growth recently, according to the U.S. Census Bureau's Business Trends and Outlook Survey (U.S. Census Bureau, 2026). Compare that to 32% at firms with 100 to 249 employees, and 37% at firms with 250 or more.
The gap isn't about smaller companies caring less. It's about most AI-BI tools assuming a data team that smaller companies don't have: someone to connect the sources, someone to build the models, someone to maintain the dashboards. Strip that requirement out, and the size gap should close on its own.
That's the actual design bar for a BI platform built for growth-stage companies rather than enterprise IT departments: connections that don't need an engineer to set up, an AI layer that explains results in plain language instead of a query language, and pricing that doesn't assume a six-figure software budget. NeuraBoard was built around exactly that constraint. See the full list of connections on the integrations page.
Daily Briefings vs. Weekly Reports: How Often Should You Check Your Numbers?
More often than a monthly report, and less often than every hour. Frequent AI users save meaningfully more time than occasional ones: 20.5% of weekly generative AI users saved four or more hours in a given week, compared to 33.5% of daily users (Federal Reserve Bank of St. Louis, 2025).
Across all generative AI users regardless of frequency, the average time saved was 5.4% of work hours, roughly 2.2 hours in a 40-hour week (Federal Reserve Bank of St. Louis, 2025). That gap between the average and daily users is the argument for a daily briefing over a weekly report: the habit compounds.
A daily AI-generated briefing costs almost nothing to read, a few minutes, versus the hour or more a weekly deep-dive demands. But it catches problems while they're still small. A weekly report catches the same problem days later, after it's had time to compound.
The two aren't mutually exclusive. A daily briefing answers "did anything change." A weekly or monthly report handles deeper trend analysis. What doesn't work well anymore is relying on the monthly report alone as your only checkpoint.
Getting Started With AI-Powered BI
Start by connecting your data, not by picking an AI feature. None of the interpretation, forecasting, or scenario modeling works without unified, current data underneath it, so that's the actual first step regardless of which platform you choose.
From there, the lowest-friction second step is asking a plain-language question you already have, something like "why did conversion rate drop this week," rather than trying to build a custom report first. That's usually the fastest way to see whether an AI layer is actually useful or just marketing.
Third, set one KPI target and let the AI layer track it for two or three weeks before judging the tool. A single monthly snapshot won't show you the value of continuous tracking. A few weeks will.
The most common hesitation is assuming this requires technical setup or a data team. It doesn't, at least not with tools built for growth-stage companies rather than enterprise IT. See how NeuraBoard connects to your existing stack without either.
Frequently Asked Questions
What is AI-powered business intelligence?
AI-powered business intelligence is BI software that interprets data instead of just displaying it, explaining why a metric changed and recommending next steps. Traditional dashboards show numbers; AI-powered BI adds analysis on top, closing the gap between having data and knowing what to do with it.
How is AI-powered BI different from a regular dashboard?
A regular dashboard requires a person to notice changes, investigate causes, and decide what to do. AI-powered BI does the noticing and the "why" automatically, often flagging issues before a scheduled report would have caught them, and can answer plain-language questions directly.
Do I need a data team to use AI-powered BI?
No. Tools built for growth-stage companies, rather than enterprise IT departments, connect to existing platforms without engineering setup. That's a meaningful shift: firms with fewer than 20 employees still report under 20% AI adoption, largely because most tools assume a data team they don't have (U.S. Census Bureau, 2026).
How fast is the AI-powered BI market actually growing?
Fast. The augmented analytics market is projected to grow from $29.81 billion in 2025 to $127.18 billion by 2031, a 27.35% compound annual growth rate, with small and mid-sized businesses the fastest-growing segment (Mordor Intelligence, 2026).
What's the difference between a Growth Simulator and a regular budget forecast?
A regular forecast projects forward based on historical trend alone. A Growth Simulator models a specific decision, like shifting ad spend between channels, against your actual connected performance data before you make it, so you can compare scenarios instead of guessing.
How often should I check an AI-powered BI dashboard?
More often than a monthly report justifies. Daily AI-generated briefings catch problems while they're still small; weekly deep-dive reports still matter for trend analysis. Frequent users see the biggest payoff: 33.5% of daily generative AI users saved 4+ hours in a given week, versus 20.5% of weekly users (Federal Reserve Bank of St. Louis, 2025).
The Bottom Line
A dashboard that only displays data hasn't finished the job. The value was always in the interpretation: what changed, why it changed, and what to do next. AI-powered BI is what makes that interpretation automatic instead of manual.
The market is moving fast, projected to more than quadruple by 2031, and small and mid-sized businesses are now its fastest-growing segment, not an afterthought to it. The gap that remains isn't about whether AI-powered BI works. It's about which companies have adopted tools built for their size, and which are still evaluating enterprise software that assumes a data team they don't have.
Centralizing your data is step one. Layering AI interpretation on top, so it explains revenue changes, models growth scenarios, and tracks KPIs against targets automatically, is what actually changes how a team works day to day. See how NeuraBoard puts that layer on top of your existing stack.
This article was written and reviewed by the NeuraBoard editorial team. Statistics were sourced from named, publicly available industry and research reports and cited inline. Have questions or a correction? Contact us.

Editorial Team
The Neura Review is written by NeuraBoard's editorial team, covering the metrics, systems, and insights behind data, AI, and growth. NeuraBoard itself is the intelligence layer that unifies revenue, ad spend, and marketing data, answering business questions directly instead of leaving teams to build reports by hand.